Payer Mix Strategy and Its Effect on SNF Operating Margins
FFS Medicare's outsized margins now subsidize Medicaid losses.

Most of what happens inside a skilled nursing facility loses money, and a small slice of it pays for everything else. That is the central fact of SNF economics, and it explains why payer mix, not occupancy rate or staffing efficiency, decides whether a facility turns a profit or bleeds cash. According to MedPAC's Report to Congress, the average non-FFS Medicare margin, which covers Medicaid, Medicare Advantage, and every other payer combined, runs at a loss. Since those categories make up the bulk of a typical SNF's patient days, most of the beds in most facilities are filled with patients whose care costs more than what's paid for it. MedPAC's report notes that the FFS Medicare margin for freestanding SNFs has exceeded ten percent for twenty-five consecutive years running, a span long enough to qualify as a permanent feature of how the industry is financed. Once that structure is visible, the rest of SNF financial strategy follows from a single question: how does an operator get more of its census into the one payer category that actually pays for itself?
The FFS Medicare margin as a cross-subsidy for Medicaid losses
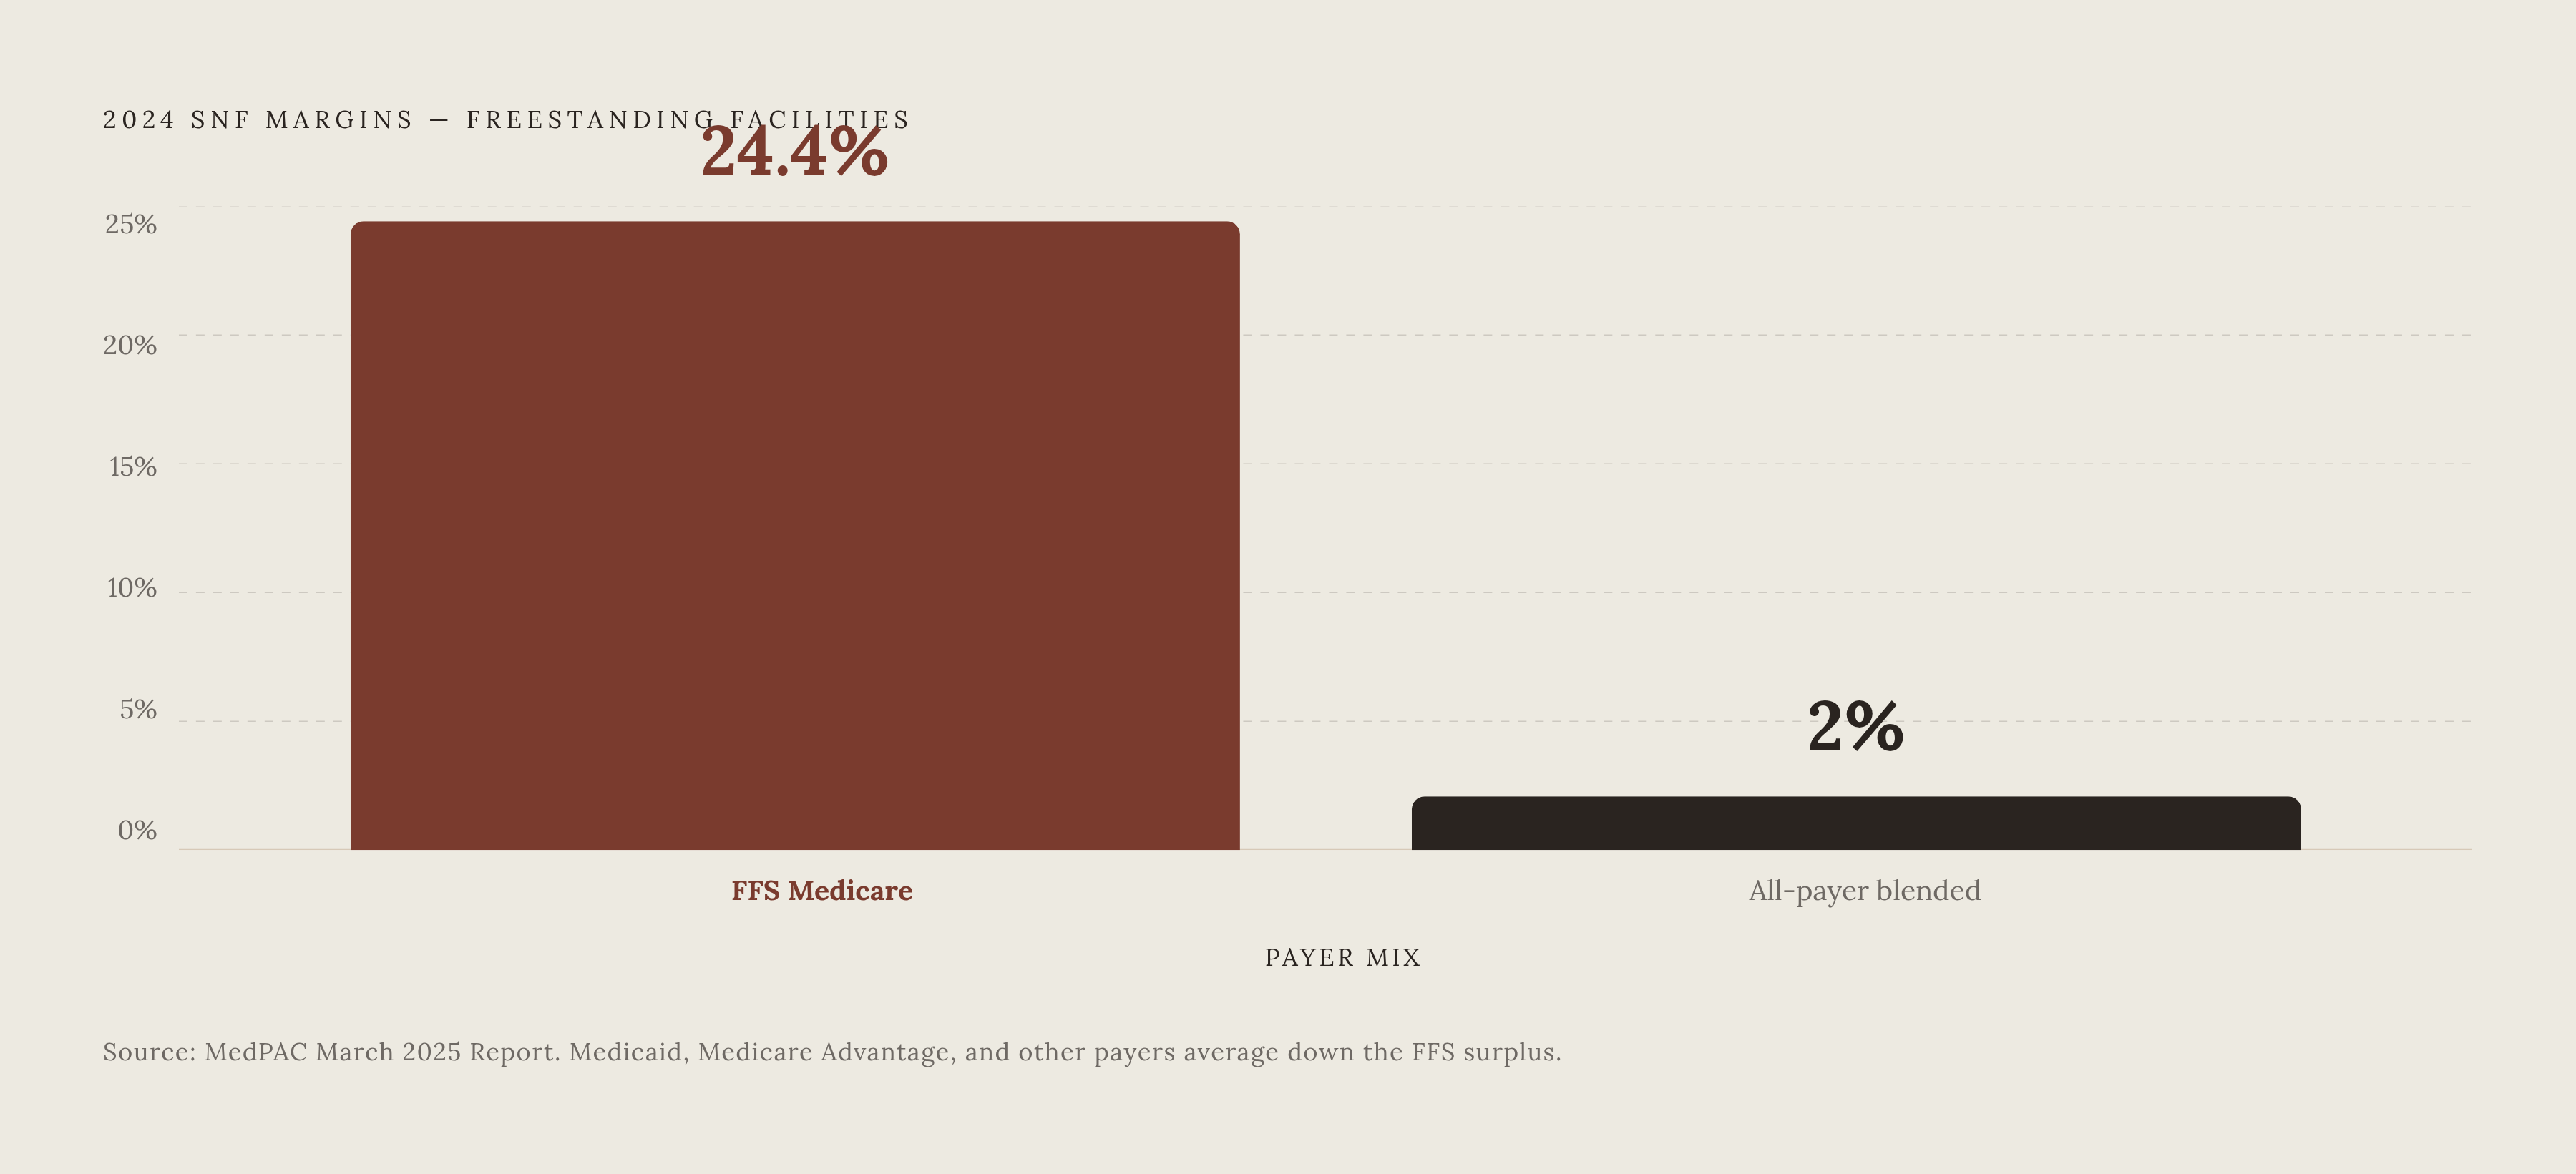
The FFS Medicare margin is not profit in the ordinary sense of money left over after costs are covered. It works as an internal transfer: surplus from a small group of short-stay, post-acute patients moves toward the much larger population of long-stay Medicaid residents, whose daily rate falls short of what their care costs. MedPAC's figures make the scale of that transfer concrete: the FFS Medicare margin for freestanding SNFs reached 24.4 percent in 2024, up from the year before, with for-profit facilities capturing that margin at a noticeably higher rate than nonprofits. Against that number, the all-payer total margin, blending every payer source together, moved from under one percent in 2023 to just over two percent in 2024. MedPAC does not dispute that operators rely on this arrangement. The commission agrees that high FFS rates make up for chronically low Medicaid rates, but it will not use that argument to keep Medicare payments elevated. In MedPAC's framing, the cross-subsidy is evidence that Medicaid financing has failed, not a reason to preserve the subsidy that's currently papering over that failure. Omega Healthcare Investors takes the opposite position in its 10-Q filings: cut Medicare without fixing Medicaid, and the funding gap doesn't close, it just moves onto operators' balance sheets, threatening solvency rather than rewarding anyone for running a tighter operation. What matters for now is simpler: any operator running a Medicaid-heavy census is, whether by design or default, already dependent on FFS Medicare margin to stay solvent, and that dependency makes FFS performance the single number worth watching above all others.
What PDPM did to the margin equation
Before fiscal year 2020, a SNF's Medicare margin was largely a function of how many Medicare beds it could fill. The Patient-Driven Payment Model changed what that margin depends on. PDPM ties per-diem payment to how precisely a facility documents patient acuity across five separate components: physical therapy, occupational therapy, speech-language pathology, nursing, and non-therapy ancillary services. But what CMS giveth, CMS can also take back. In its FY 2027 rulemaking, CMS issued a Request for Information asking for methodologies to measure PDPM upcoding, with comments due June 1, 2026, and the final rule confirmed that CMS will take those responses under advisement for future recalibrations. The exact coding precision that maximizes FFS margin today is what regulators are now building tools to price-correct tomorrow. The primary lever an operator controls inside the Medicare payment system is also the lever most exposed to regulatory revision, and that tension should shape how aggressively any facility leans into acuity capture over the next several years.
How Medicare Advantage is compressing the highest-margin patient population
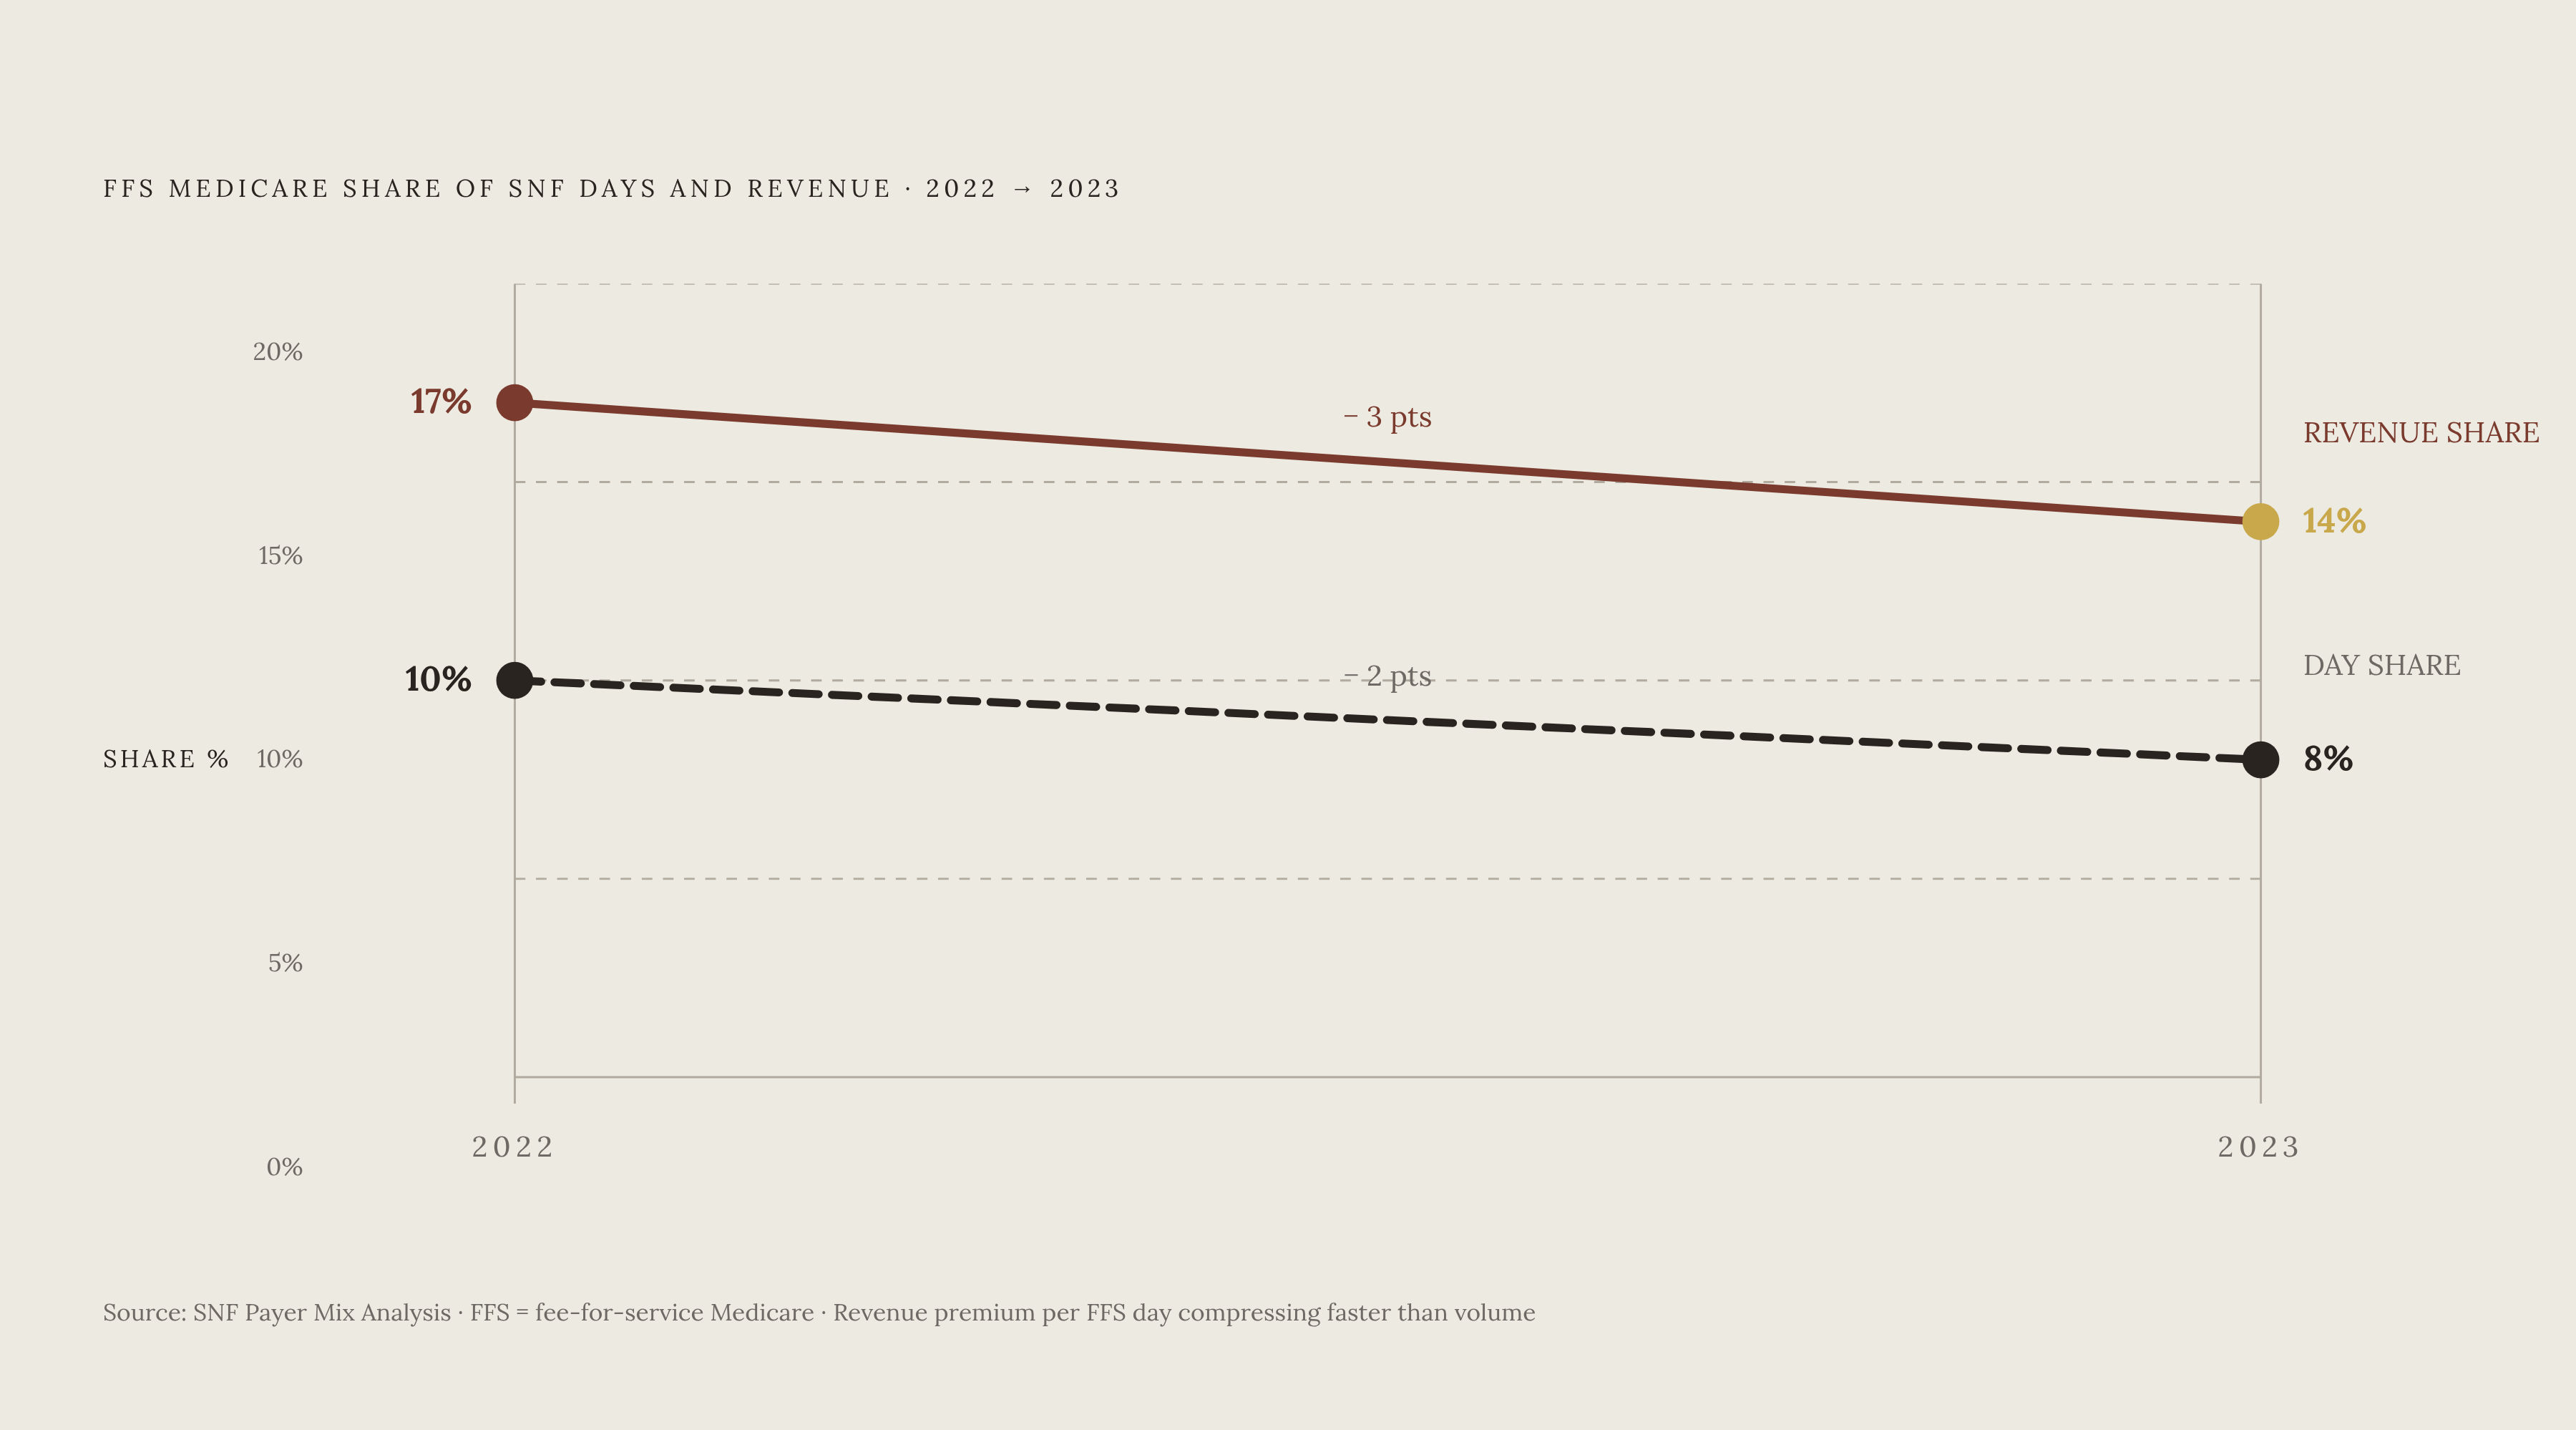
FFS Medicare already represents a small fraction of total SNF days, and that fraction keeps shrinking as more beneficiaries enroll in Medicare Advantage. The data from the SNF Payer Mix Analysis covering 2024 and 2025 shows the FFS share of facility days falling from roughly ten percent in 2022 to roughly eight percent in 2023, with the revenue share tied to those days dropping from about seventeen percent to roughly fourteen percent over the same two years. Why does this matter so much more than a simple shift in enrollment numbers would suggest? Every beneficiary who moves from traditional Medicare into an MA plan is not a neutral event for a SNF's bottom line; it is a profitable admission being replaced by a loss-generating one. But the picture isn't uniformly bleak, and this is where the nuance matters. Research published through PMC finds that among SNFs with a lower share of short-stay residents, MA enrollment is tied to higher occupancy rates, so if a facility leans toward long-stay care, MA can stabilize its census even though it pays less per day than FFS would. That finding argues against treating MA as something to avoid categorically. It argues instead for operators to know which population they actually serve, a short-stay rehab-focused building and a long-stay custodial-care building face very different trade-offs when an MA contract comes across the table, and the right response depends on which one a given facility is.
Why Medicaid exposure cannot simply be reduced
Medicaid poses a different problem than Medicare Advantage does, because Medicaid patients make up the large majority of SNF days, and facilities can turn away only so many Medicaid admissions under the law. For most operators, shrinking Medicaid volume is rarely a realistic way to cut Medicaid exposure. What is realistic is paying close attention to where Medicaid rates are set and how policy changes will move them. The loss generated by a Medicaid patient is not a fixed, universal number. MedPAC's report notes that individual states' Medicaid nursing home rates heavily shape overall SNF financial performance, so a facility's Medicaid margin can hinge on which state it operates in as much as on the acuity of the patients it treats. That geographic variation is about to matter more than it has in years. The One Big Beautiful Bill Act became law in July 2025, and certain states could now see cuts to their federal Medicaid matching dollars. Whether that translates into lower reimbursement for operators depends on how individual states respond, and Omega Healthcare Investors flags this contingency directly in its FY2025 10-K: if states cut provider rates in reaction to reduced federal matching, even modest per-diem reductions on a majority-Medicaid census can cascade into real financial distress. MedPAC's report admits it cannot say for sure what these requirements will cost, and the burden falls unevenly. Medicaid-heavy facilities absorb those added staffing costs with no automatic rate offset built in, but FFS-heavy facilities can at least recover some of the cost through higher per-diem Medicare margins. Operators who can lean on FFS Medicare to cushion new mandates pull further ahead of operators who cannot, and the gap widens.
How occupancy, scale, and financial health compound payer-mix advantages
Not every SNF has equal access to the strategy described so far. Attracting higher-acuity Medicare admissions takes clinical capability, and clinical capability takes capital. Payer-mix strategy therefore favors facilities that already have strong finances, solid occupancy, and enough scale to invest. This gap widens over time. PMC research finds that SNFs with stronger financial performance see higher occupancy for each unit increase in FFS Medicare and MA payer share, compared with facilities sitting in the lowest profit-margin quartile, and the effect is larger for MA than for FFS. In other words, a margin-healthy facility extracts more value even from a lower-paying payer than a distressed facility can extract from that same payer. MedPAC's report found that smaller facilities post lower average FFS Medicare margins than mid-size facilities do, and that low-volume facilities in the bottom quintile of total days post lower average FFS Medicare margins than high-volume facilities in the top quintile do. Size, in other words, is close to a precondition for capturing the full value of the Medicare advantage, not simply a correlate of it. One might ask why scale would matter this much for a single payer category. Building that kind of clinical infrastructure costs money, and the money available to build it comes largely from the FFS margin a facility is already earning. If a facility earns a strong FFS margin today, it can invest in the capability that earns an even stronger FFS margin tomorrow, but a facility without that margin has little capacity to build toward it. That compounding dynamic is the turning point in this whole discussion, because it explains why payer-mix strategy is not a one-time decision but an ongoing, self-reinforcing process, and it sets up the question of what operators can actually do to get on the right side of it.
The practical levers operators use to shift payer mix toward higher-margin admissions
Deliberate payer-mix management runs through three connected levers: attracting higher-acuity Medicare referrals, negotiating managed care contracts that recover more than the cost of delivering care, and using PDPM documentation to capture the full rate a patient's condition actually justifies. Referral strategy starts with hospital discharge planners, who route their most complex, highest-acuity patients to facilities that have demonstrated they can handle them. A SNF that has built out cardiac, orthopedic, wound care, or ventilator programs positions itself for the admissions that carry the heaviest PDPM weighting, and those same patients tend to be the ones least likely to shift toward MA plans in the near term. Ensign Group's Q1 2026 10-Q offers a documented look at what this kind of management looks like at scale: the filing tracks Medicare as a distinct revenue concentration risk and specifically flags that statutory changes, rate adjustments, and government funding restrictions could materially affect Medicare reimbursement. Treating payer mix as a financial risk to be managed, rather than a byproduct of whoever happens to need a bed, is what separates sophisticated operators from the rest. Managed care contracts deserve the same scrutiny. As MA enrollment keeps growing, facilities that accept whatever terms an MA plan offers, without pushing for rate floors, reasonable authorization requirements, or defined length-of-stay norms, are effectively handing margin to the plan without a fight. Geography adds another layer to factor into strategy. If you run facilities across several states, you should set payer-mix targets by market, because a single national benchmark may not fit any one of them.
Why MedPAC's rate-reduction recommendations make payer-mix strategy more urgent
The most consequential threat to the entire structure described above is MedPAC's own multi-year push to cut the FFS Medicare base rate that funds the cross-subsidy everything else depends on. The threat carries weight less because the cuts are guaranteed and more because the logic behind them is consistent and the commission keeps repeating it. MedPAC's report recommended a four percent cut to 2026 base rates for fiscal year 2027, and the commission passed it by a unanimous vote, and unanimity like that tends to carry real weight with Congress even in years when it doesn't immediately become law. Look at the trajectory across recent cycles: a three percent cut recommended for FY 2025, a current-law-plus-one-percent increase for FY 2026, and now a four percent cut recommended for FY 2027. That pattern reads less like routine policy adjustment and more like a commission growing steadily less patient with margins it considers excessive. CMS's enacted FY 2027 rule delivered a net increase of only about 2.4 percent, below both inflation and cost growth, so the real-dollar FFS margin is being compressed every year by the gap between what the update factor allows and what costs are actually doing. The strongest pushback against all of this, that cutting Medicare without fixing Medicaid simply moves the funding gap onto operators rather than rewarding anyone for efficiency, is a fair point. It does not, however, change what operators need to plan for: a future where the FFS margin is thinner, and where acuity capture, managed care negotiation, and Medicaid rate advocacy all matter more than they did five years ago, not less.
Accurate financial reporting and audit discipline for payer-mix strategy
Every strategy described in this piece, acuity capture under PDPM, Medicaid cost reporting, managed care revenue recognition, depends on the accuracy and timeliness of the financial data behind it. Audit quality is not a compliance afterthought bolted onto payer-mix strategy; it is one of the conditions that makes the strategy possible to execute and defend. Under 24 CFR 232.1009, borrowers must provide HUD and the lender an audited annual financial report, and operators must submit quarterly financial statements within sixty calendar days of the close of each fiscal quarter. The updated Section 232 Handbook, with provisions effective January 5, 2026, applies to all new loan applications and to transactional requests on existing Section 232 projects, so any operator entering or refinancing through this program now faces fresh compliance obligations layered on top of the payer-mix reporting already built into its cost reports. PDPM scrutiny adds another dimension to this same problem. If CMS moves toward recalibrating rates based on upcoding evidence, operators whose documentation is aggressive but not clinically supported face two separate risks at once: rate clawbacks from CMS and damaged credibility with the hospital referral partners whose trust drives the acuity-capture strategy described earlier. Running Medicare FFS under PDPM, Medicaid cost-based settlements in some states, MA contracts, and HUD financial covenants all at once produces a genuinely complicated revenue picture, one that calls for accounting partners who understand the regulatory terrain of each payer rather than generalists treating the SNF cost report like any other industry's financial statement.