SNF Value-Based Purchasing Program Penalty and Bonus Mechanics
Low-performing facilities lose millions to VBP penalties that erase rate increases.
The Skilled Nursing Facility Value-Based Purchasing Program moves money between facilities based on performance, and every Medicare-certified SNF is already a participant whether or not its leadership has sat down and modeled what that means in dollars. The FY 2026 VBP adjustments for facilities facing net payment reductions add up to an estimated $208.36 million. That number sits next to a 3.2% SNF PPS rate update worth roughly $1.16 billion more than FY 2025, and for low-performing facilities, the withhold eats meaningfully into whatever gain that broader rate increase was supposed to deliver.
How the Incentive Payment Multiplier Converts a Score Into a Payment Change
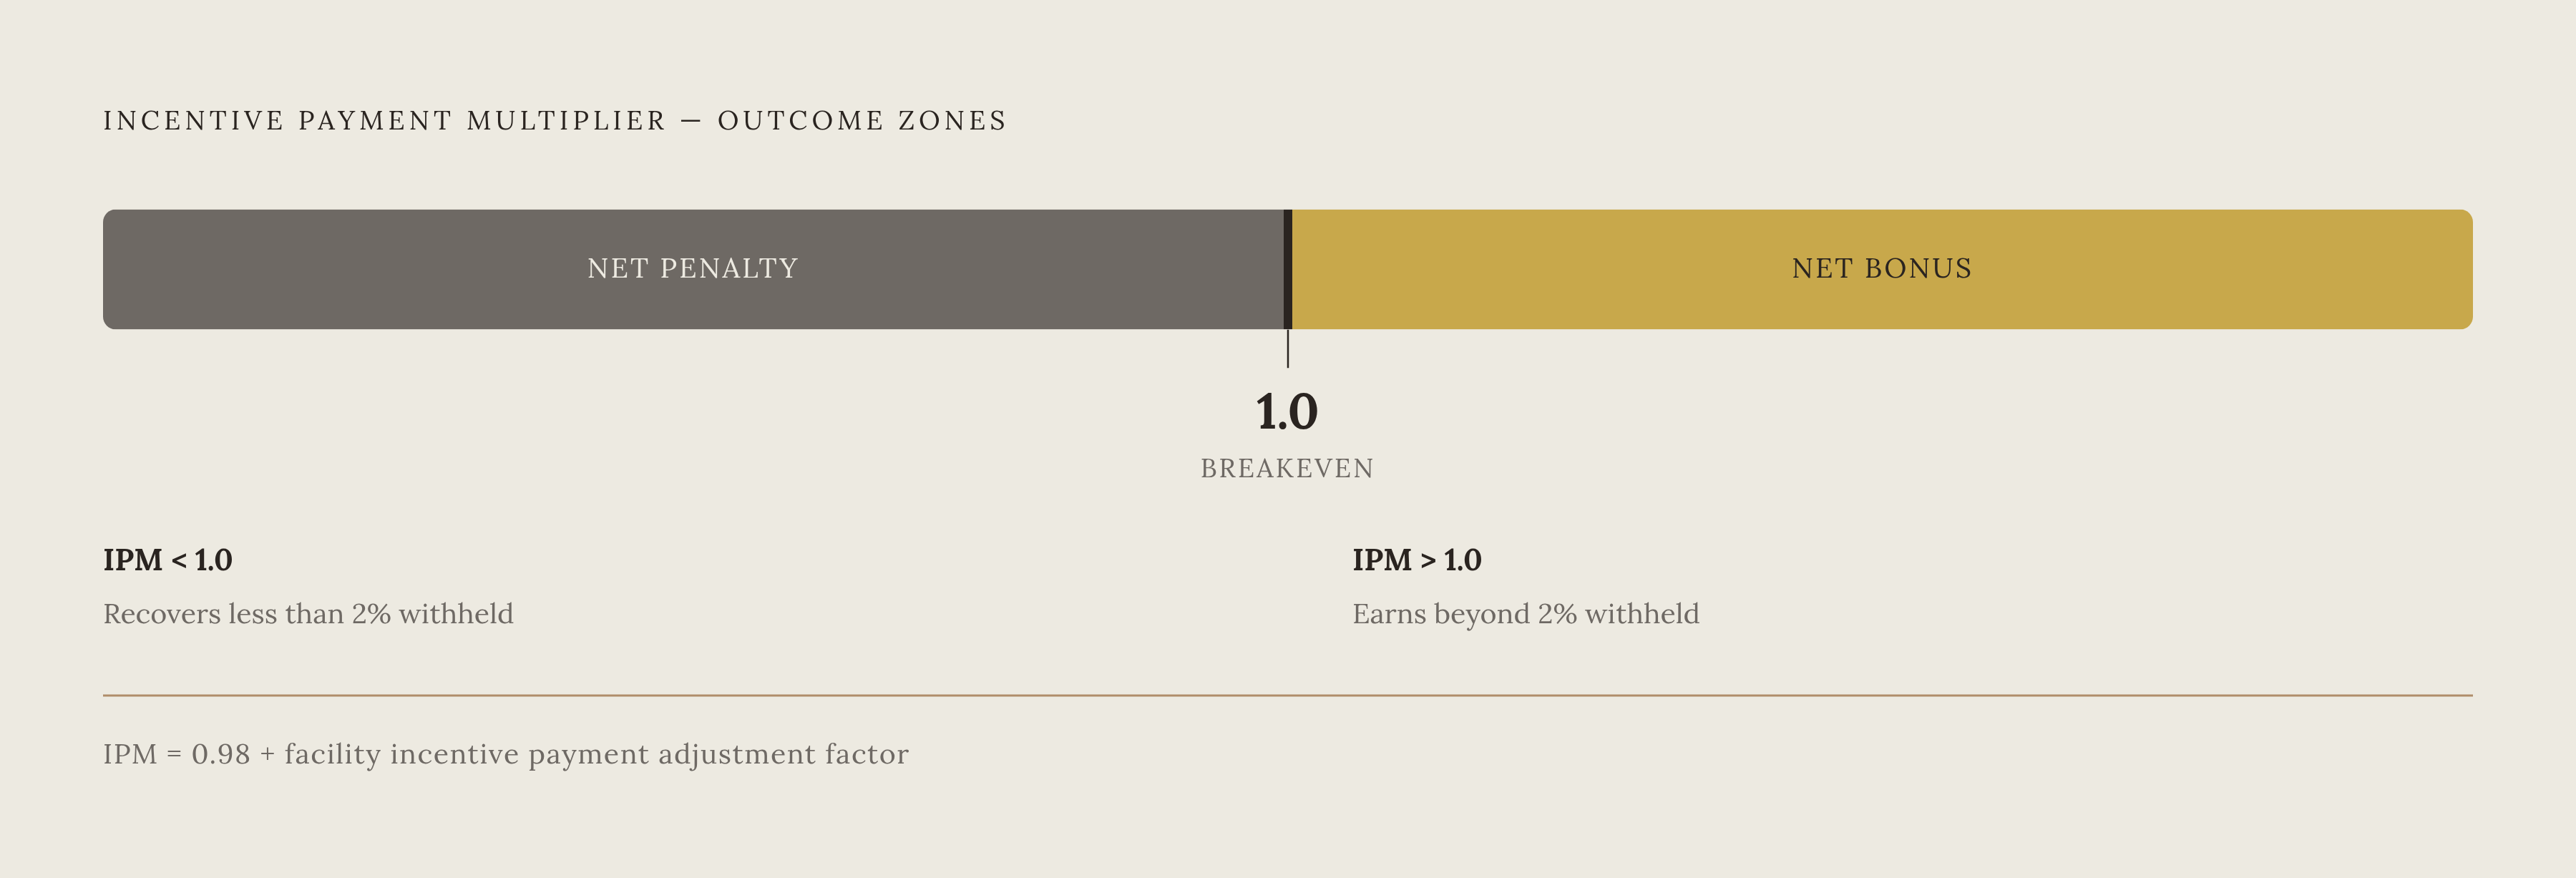
The single number that decides whether a SNF comes out ahead or behind is the Incentive Payment Multiplier, or IPM. It accounts for the 2% withhold and the incentive payment adjustment at the same time, and CMS applies it to the adjusted federal per diem rate for every Medicare Part A claim paid under the program during that year. The calculation itself is simple: CMS adds 0.98 to the SNF's incentive payment adjustment factor to produce the IPM. What that number does afterward sets the stakes: an IPM below 1.0 means the facility gets back less than the 2% it had withheld, a straightforward penalty. An IPM of exactly 1.0 means the facility breaks even, recovering precisely what was taken. An IPM above 1.0 means the facility earns more than the withhold, a genuine net bonus funded in part by the money other, lower-scoring facilities failed to earn back. CMS applies the IPM prospectively to every Medicare FFS Part A claim under the SNF PPS starting October 1 of the applicable program year, and it tells each facility its adjustment factor at least 60 days ahead of that date, giving administrators a narrow but real planning window.
The adjustment factor behind the IPM does not come from a facility's raw score alone. It comes from where that score ranks against every other participating SNF, run through what CMS calls a logistic exchange function. That asymmetry is why the score-building mechanics in the next section matter so much. A facility cannot reason about its IPM by only asking "did we improve?" It has to ask "did we improve relative to everyone else being ranked at the same time?"
How achievement and improvement scores are calculated and combined into the performance score
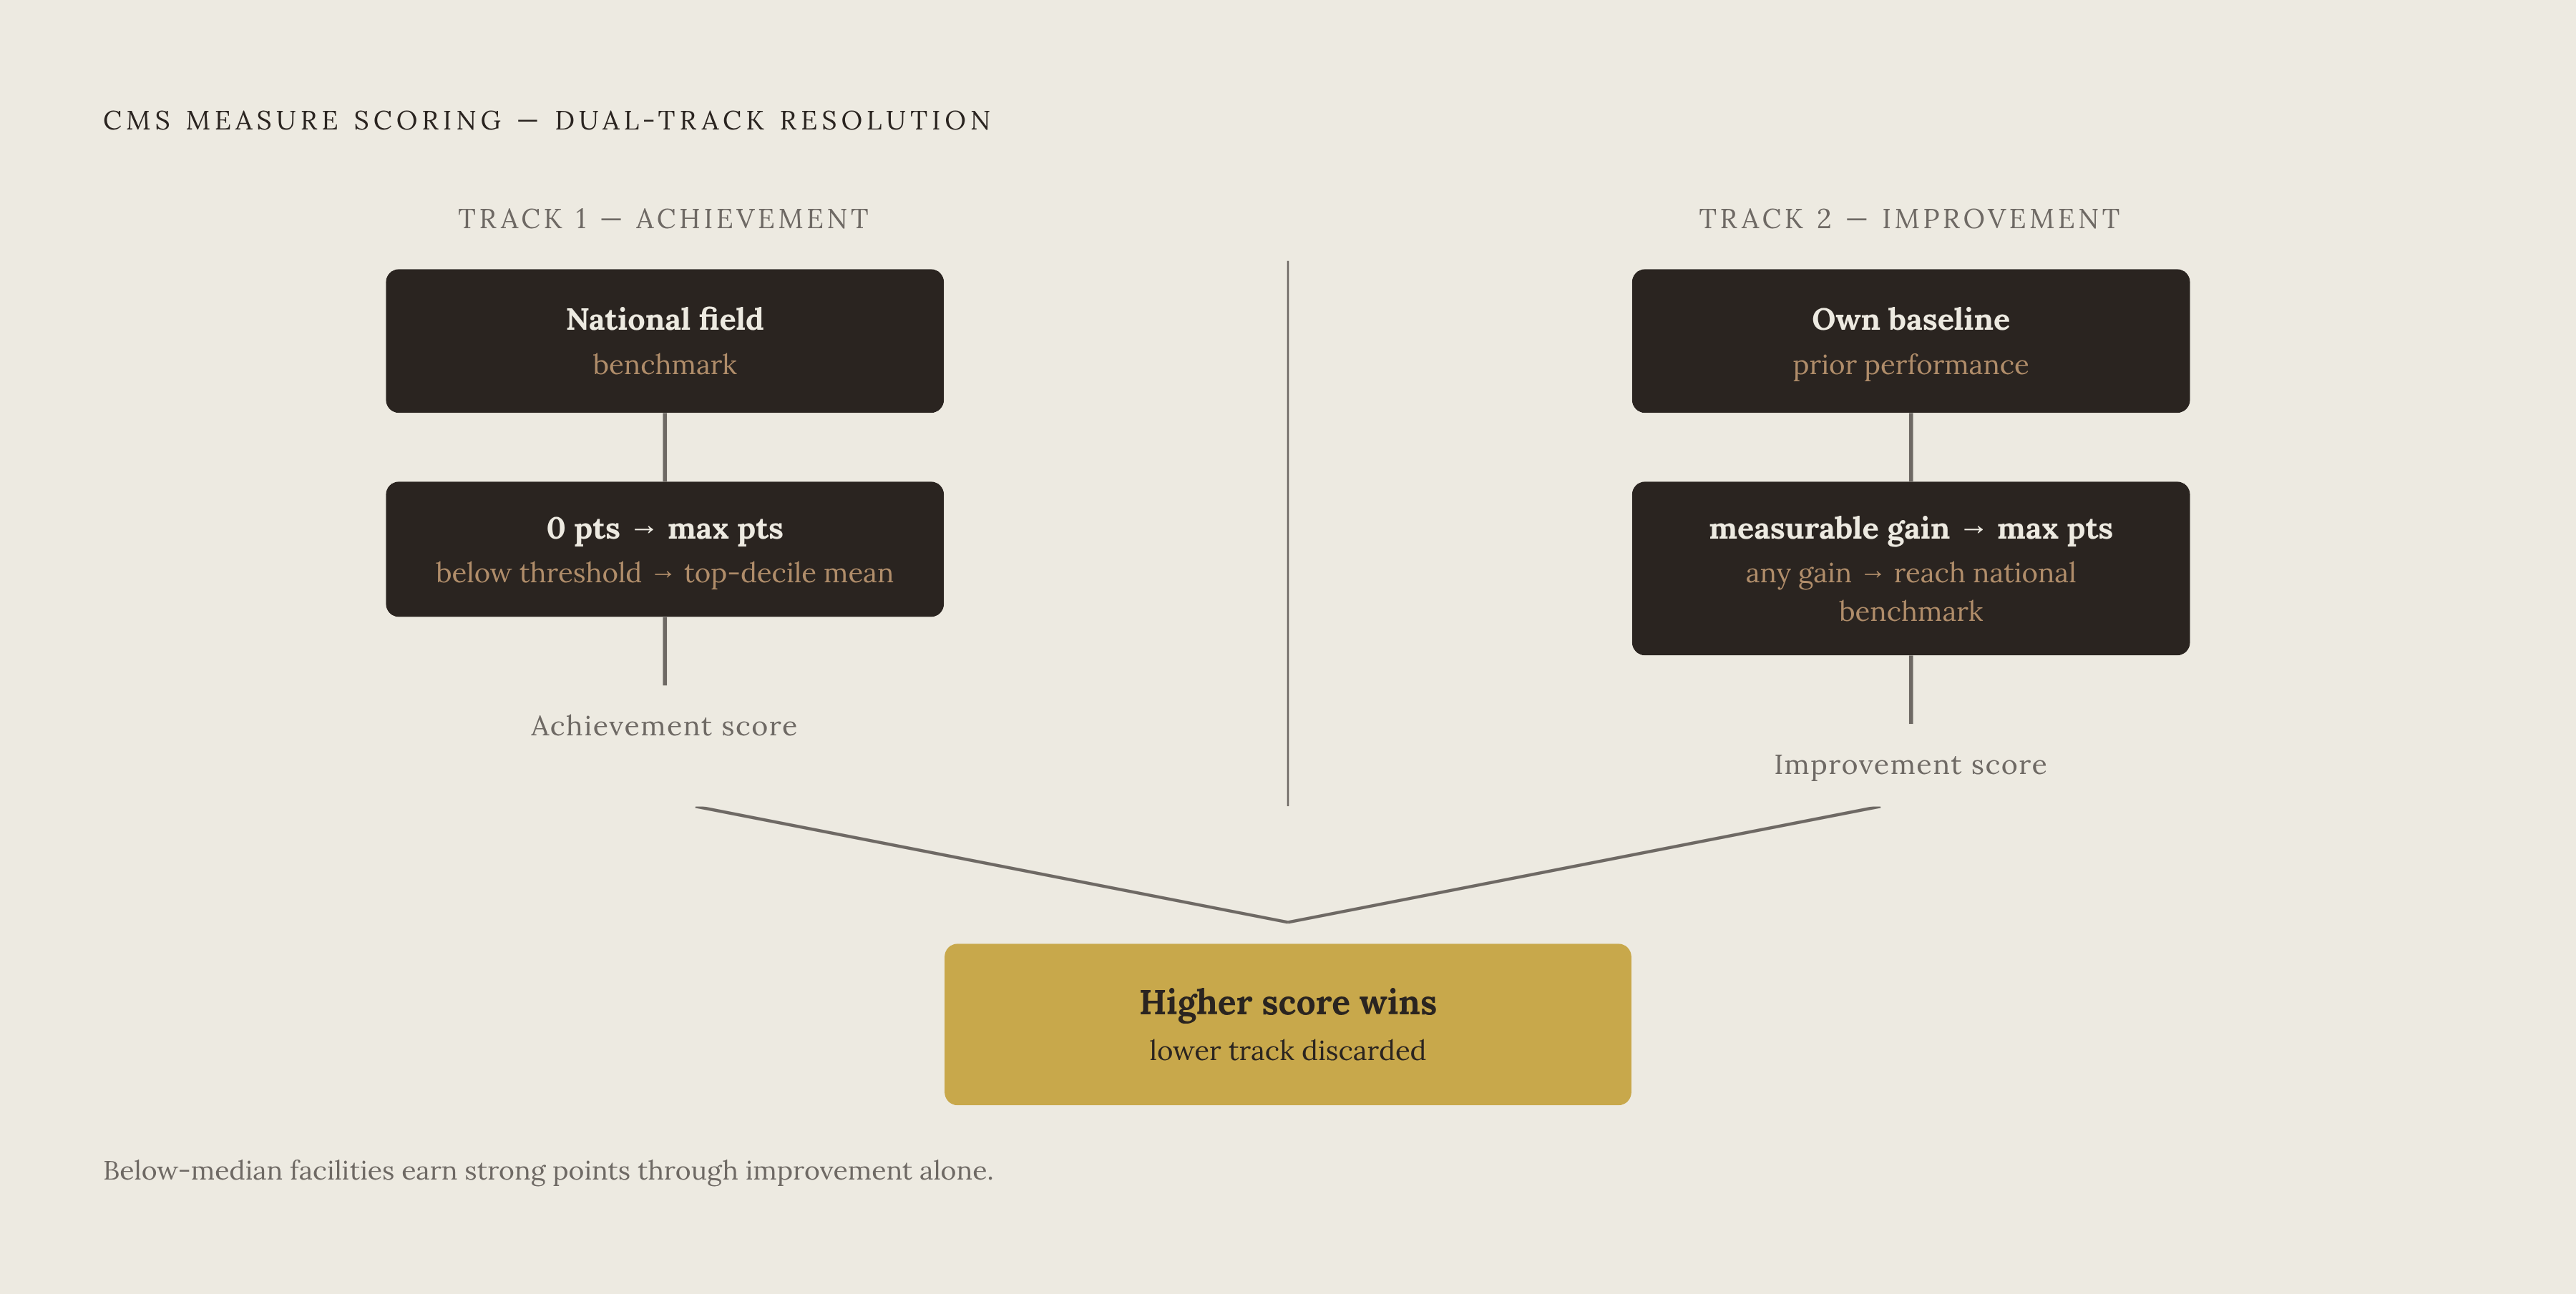
Every performance score is assembled from measure-level scores, and each measure gives a facility two separate chances to earn points: one based on how it stacks up against the national field, the other based on how much it has improved against its own past performance. That structure matters for mid-pack facilities in particular, because it means a SNF nowhere near the top nationally can still bank meaningful points by beating its own prior numbers.
Achievement scoring works off two benchmarks CMS sets during the baseline period. The benchmark sits much higher: the arithmetic mean of the top decile of national performance, the ceiling where a facility earns the maximum achievement score. A facility at or above that benchmark gets full achievement points; a facility below the threshold gets zero.
Improvement scoring runs on a separate track. Here, the comparison point is not the national field but the facility's own result during the baseline period. The improvement threshold is simply that facility's own prior performance, so even a modest, measurable gain clears the bar. A facility that climbs all the way up to or past the national benchmark earns maximum improvement points no matter how far behind it started.
Consider a facility that entered the baseline period performing below the 25th percentile nationally on a given measure, too far back to earn much on achievement, but that made steady operational changes and posted a real gain by the performance period. That facility might score poorly on achievement but strongly on improvement, and CMS does not average the two. For each measure, the facility receives whichever of the two scores is higher. The weaker pathway is simply discarded. The FY 2026 performance score sums the points earned across every measure this way, then normalizes the total into points out of 100. For FY 2026, the baseline period is FY 2022 and the performance period is FY 2024, so the comparison a facility is actually being judged against reaches back two full years.
The four measures in the FY 2026 program and the minimum participation threshold
FY 2026 expands the program from a single measure to four. The performance score is now built across a wider and considerably more complex mix of clinical and staffing data than facilities had to manage in prior years.
Alongside that expansion, CMS introduced something administrators who have spent years tracking only the readmission number may not have fully registered yet: the Measure Minimum Policy. Falling short of that threshold does not simply mean a lower score. It means exclusion from the program. An excluded facility receives its adjusted federal per diem rate with no VBP adjustment applied, so it neither earns a bonus nor absorbs a penalty based on performance.
That sounds neutral, but it is not a safe outcome to land in. Exclusion is a guaranteed loss equal to the full withhold, which makes the Measure Minimum Policy a data-reporting deadline with real financial teeth, not a bureaucratic footnote.
What the distribution of actual penalties and bonuses looks like across the SNF field
Looking at how the program has actually paid out helps explain why the mechanics above deserve this much attention. Across the program's first three fiscal years, most SNFs did not come out ahead. Research covering FY 2019 through FY 2021 found that roughly two-thirds of SNF-years ended in a penalty, and more than a quarter of those facilities took the maximum penalty available. That is not a story about widespread mismanagement so much as a story about how hard it is to clear the IPM breakeven point when CMS is ranking every facility against every other facility nationally.
The same research found striking year-to-year volatility: only about a fifth of SNFs stayed in the same performance quartile across all three years studied, and many of the facilities that moved quartiles jumped more than one quartile in a single year. That instability carries a practical warning. A strong performance year does not insulate a facility from a penalty the following year, because the competitive ranking resets with each new comparison period, and the field a facility is ranked against is never the same field twice.
Financial fragility compounds the risk. A facility losing money under the program may be losing exactly the staffing capacity it needs to improve its score the following year.
Geography and community wealth appear to play a role too. A study in the Journal of the American Geriatrics Society found that facilities in socioeconomically deprived ZIP codes, in urban locations, and in the South were significantly more likely to receive maximum penalties, a distributional pattern the authors found was not fully explained by differences in clinical performance alone. What does that imply for a facility operating in one of those settings? At minimum, that the scoring mechanics interact with factors well outside clinical quality, and understanding that interaction is part of understanding the program itself.
Why the Readmission Measure Is Structurally Hard to Move
The readmission measure deserves closer scrutiny because its 30-day window extends well past the period during which a facility has any direct clinical authority over the patient. Why does this matter for a facility trying to improve its score? Because no amount of in-house clinical excellence closes a gap that opens up after discharge.
Researchers studying this dynamic have concluded that facilities hoping to earn bonuses on this measure may need to build genuine post-discharge monitoring and hospital readmission avoidance programs reaching into the community, a capability most SNFs simply do not have at scale today. Reporting in McKnight's found that the program has not improved SNF hospital readmissions at the population level, a result that points to a broader lesson: understanding the scoring rules is necessary, but it is not sufficient on its own to move this particular measure.
External shocks can scramble the program's mechanics for everyone at once, too. During the COVID freeze in FY 2022 and FY 2023, CMS still collected the full 2% withhold from every provider but paid back only 60% of it, or 1.2%, to most facilities (low-volume SNFs received their full withhold back in FY 2022). That episode shows the program's structure can produce a net loss across the entire field simultaneously, independent of any individual facility's clinical performance. It is a reminder that the readmission measure, and the program generally, rewards operational reach beyond the facility's walls and beyond the length of the stay itself, not operational excellence confined to the building.
What Changes in FY 2027 and FY 2028
CMS has already finalized measure changes for FY 2027 and FY 2028, and because performance periods for those years are already underway or close to starting, facilities that wait for the program year itself to begin before adjusting operations will have already locked in baseline or performance data they cannot revise. That raises an important question: what, specifically, is coming?
Starting with FY 2028, the SNF readmission measure changes. Where the old measure counted all-cause readmissions within 30 days of discharge from the prior hospitalization, the new measure narrows its focus to potentially preventable readmissions that happen during the SNF stay itself, a tighter and more clinically specific target than its predecessor.
CMS has also already finalized performance standards for both the FY 2028 and FY 2029 program years, so the benchmarks and achievement thresholds a facility will be measured against in those years are set now, years before the scoring actually happens. And the Health Equity Adjustment, which some facilities had already folded into their revenue projections, has been removed from the scoring methodology in the FY 2026 rule. Facilities that built that adjustment into forward-looking models need to revise those projections to reflect its absence.
CMS Validation Audits, MDS Accuracy, and VBP Revenue
Every measure feeding into the performance score traces back to Minimum Data Set submissions. MDS coding accuracy determines where a facility ranks and what IPM it receives. That link runs in both directions: accurate coding supports an accurate score, and inaccurate coding, even unintentional, can shift that score in ways that change the payment the facility receives.
CMS has built an enforcement layer around this link through its Validation Audit program, with Healthcare Management Solutions, LLC conducting the audits and up to 1,500 facilities randomly selected each year to verify that the MDS items supporting both the Quality Reporting Program and VBP are coded correctly. An audit finding that MDS items were coded inaccurately can change the measure scores built on that data, which changes the performance score and the IPM that flows from it. Treating MDS accuracy as something handled quietly in the back office, separate from revenue strategy, misreads what this audit program actually does to a facility's financial exposure.
CMS has also finalized a new reconsideration process, letting facilities appeal initial decisions on Review and Correction requests before affected data becomes public. That pathway only works for a facility that already has the internal documentation to support its case. Defensible MDS coding has to be a practice maintained throughout the entire performance period, not a scramble assembled after a preliminary score arrives and a facility realizes something looks wrong.
VBP Exposure, HUD 232 Financing, Tax Planning, and Vendor Controls
VBP revenue swings land harder on operators financed through HUD Section 232 mortgages, because the surplus cash restrictions built into that financing structure limit how much flexibility an operator has to absorb a penalty year. Section 232 borrowers already submit audited annual financial statements compliant with HUD's Uniform Financial Reporting Standards, along with separate quarterly reporting, a compliance load that runs alongside VBP reporting obligations.
An April 2, 2026 HUD OIG audit covering four portfolios, 70 properties, and 84 loans found that HUD's internal oversight office had not always acted on financial risks that borrowers' own audited statements had already disclosed, including fund withdrawals made when no surplus cash existed, cash deficiencies, and insufficient cash flow to service debt. That gap between disclosure and enforcement carries going-concern implications for operators already managing VBP-driven revenue swings on top of everything else. Surplus cash restrictions require borrowers to show positive surplus cash, and where surplus cash runs negative, any distributions taken must be repaid within 30 calendar days unless HUD approves a longer window. A VBP penalty year is exactly the kind of event that can push a borrower into that negative position and trigger the restriction.
Tax exposure follows a similar logic. Pass-through owners and their tax advisors need to model that distinction to understand what a penalty or a bonus year actually does to owner cash flow, and that modeling works best as a proactive exercise built around bonus-year and penalty-year scenarios, not a task picked up for the first time at year-end.
Third-party vendors add one more layer that merits close examination. When a facility outsources data processing or billing to one of these vendors, auditors typically request that vendor's SOC reports to evaluate its controls over financial reporting and data security. A SOC 2 Type II report should be treated as a starting point for assessing a vendor's control environment, not as the final word on it. Weaknesses in that environment do not stay contained to the vendor. They can travel straight into the MDS submissions and measure data that ultimately determine a facility's performance score. A facility's VBP outcome depends in part on controls it does not directly operate.
Sources
- Size of the Financial Incentives in Medicare’s Skilled Nursing Facility Value-Based Purchasing Program - PMC
- 42 CFR § 413.338 - Skilled nursing facility value-based purchasing program.
- Penalties in 2024 in Medicare's Skilled Nursing Facility Value‐Based Purchasing Program - Wheeler - 2025 - Journal of the American Geriatrics Society - Wiley Online Library
- FY 2026 Program Year Fact Sheet
- FY 2026 Skilled Nursing Facility (SNF) Prospective Payment System Final Rule (CMS-1827-F)